Introduction
In Figure, you can preview and download the Sales By Items report as well as Modifiers By Item and Modifiers By Group. This report is a valuable tool for understanding which of your offerings are most popular and contribute the most to your revenue. By analyzing the data in this report, you can make informed decisions about inventory management, marketing efforts, and product placement.
Navigation
You can access the Sales By Items report in two convenient locations:
Figure Manage (Website): Here, you can view the report directly and also export it as a CSV file for further analysis or record-keeping (Figure Manage, go to Reports > Sales By Items)
POS (iPad): You can also access this report directly on your iPad Point of Sale system for quick insights (main Menu > Reports > Sales by Item)
Sales by Items in Figure Manage:

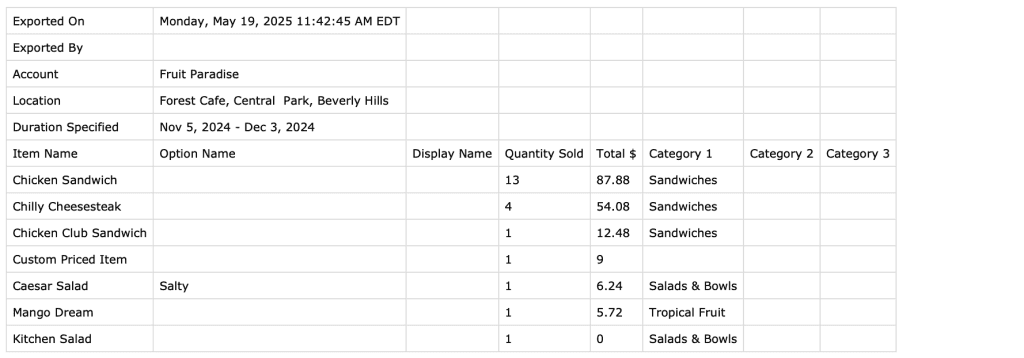
In the agenda, you will find three tabs / reports:
Sales By Items: provides a detailed breakdown of your product sales performanc
Modifiers by Item: shows performance of modifiers (add-ons, customizations) associated with individual items
Modifiers by Group: an overview of modifier performance grouped by modifier groups
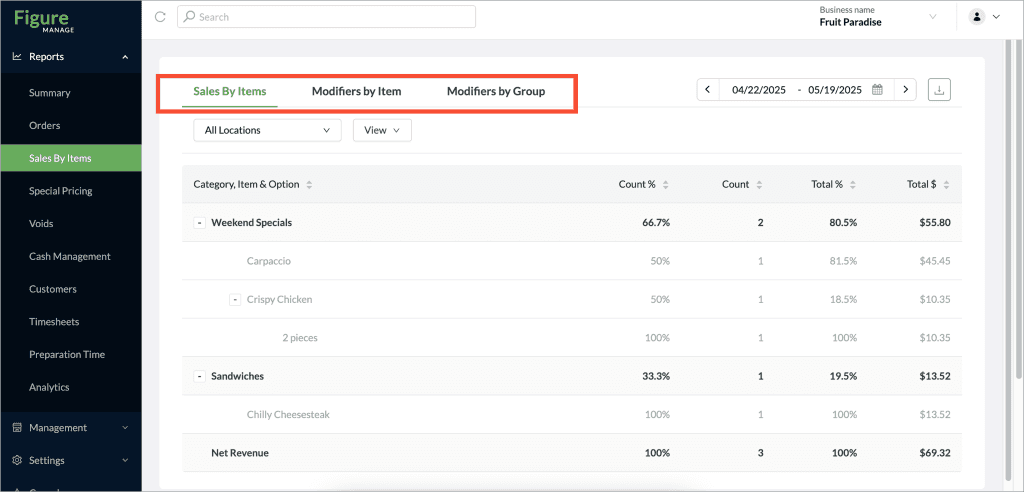
In Figure Manage, use filters to see the required data:
select Location/s
select Date Range
select View: choose if you want to collapse / expand, or show / hide categories or % of Total
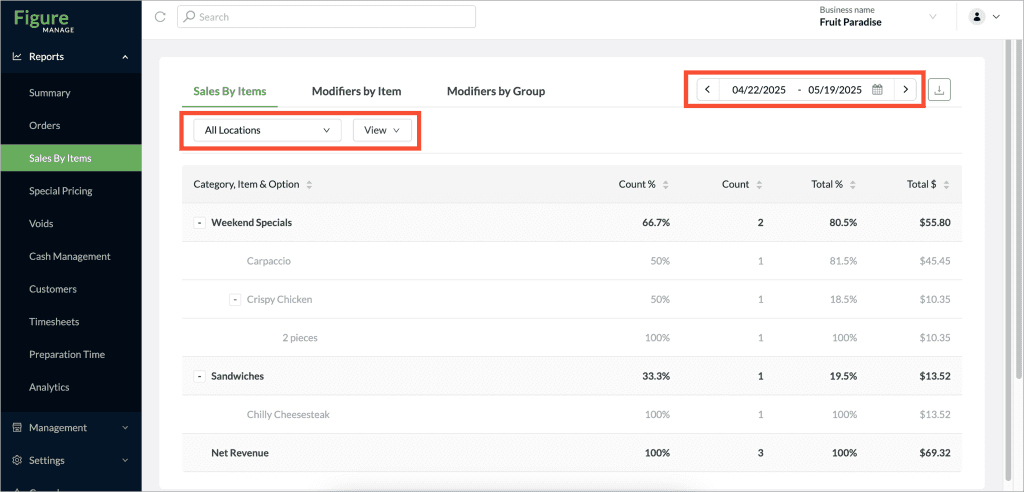
You'll always find the Net Revenue totals presented in the bottom row of the report:
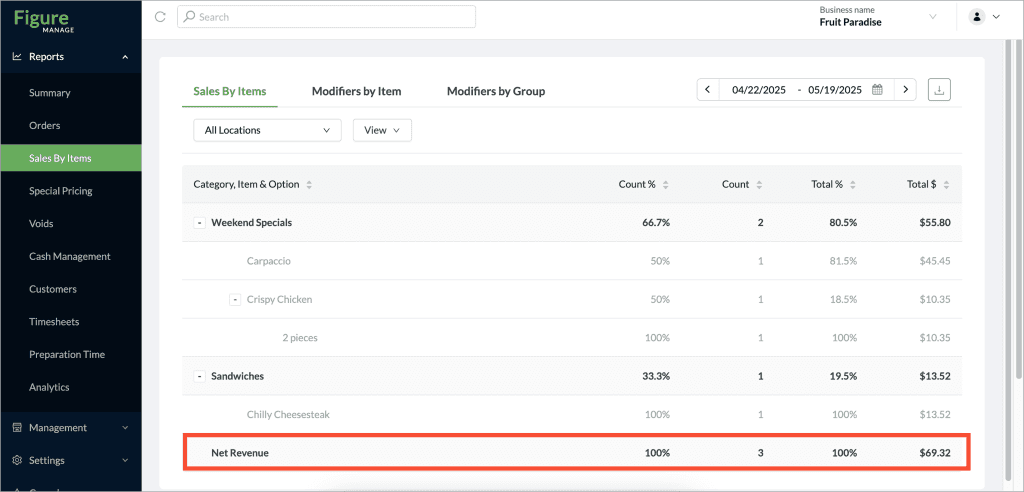
Key Metrics
In each tab / report, you will see the metrics below
Count %
Category Level: This shows the percentage of the total number of items sold that belong to a specific category.
Item Level: This shows the percentage of the total number of items sold within that category that a specific item represents.
Count
Category Level: This indicates the total number of individual items sold within that category.
Item Level: This shows the specific number of times a particular item was sold.
Total %
Category Level: This represents the percentage of the total sales amount that comes from all the items within a specific category.
Item Level: This represents the percentage of the total sales amount generated by a particular item.
Total $
Category Level: This displays the total monetary value of all items sold within that category
Item level: This shows the total sales amount generated by a particular item.
Reports
Sales by Items
The Sales by Items report gives you a detailed view of how each product is performing. For every item (and its options), the report shows:
Unit Amount – shows the number of units of unit-based and catering items
Count – how many times the item was sold
Total $ – the total revenue generated from that item’s sales
Total % – the percentage of overall sales this item represents
NEW: In September 2025, we improved the Sales by Items report. The update included:
Improved loading speed for quicker access
Expanded time range filter to analyze sales across longer periods
Custom-priced item data now included
Item options data now included
A new Unit Amount column added for clearer reporting on unit-based and catering items.
In the screenshot below, you’ll see the new Unit Amount column, as well as the newly added Options displayed in the report:

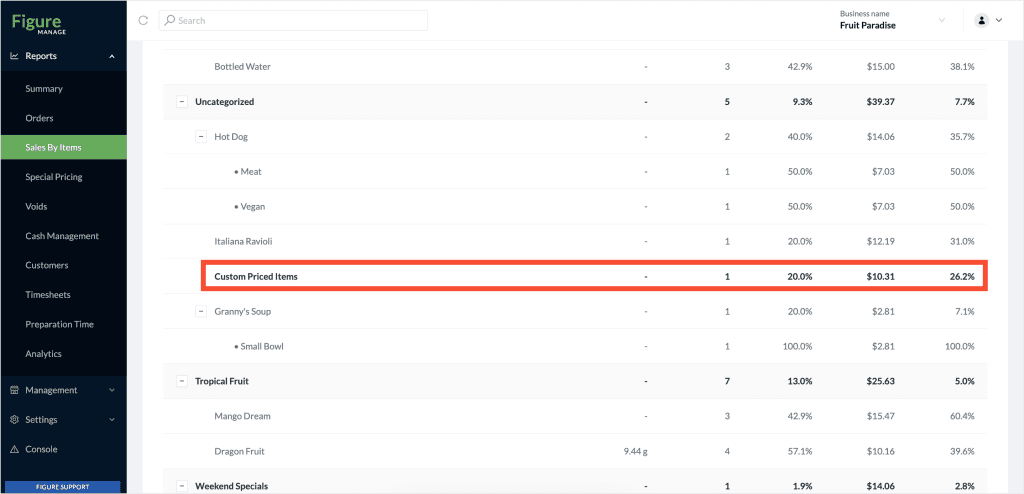
In this following screenshot, you can see how custom-priced items are displayed in the report. All custom items, regardless of their individual names, are aggregated into a single row labeled Custom Priced Items.
Understanding 'Categories, Items & Options'
Category, Items & Options
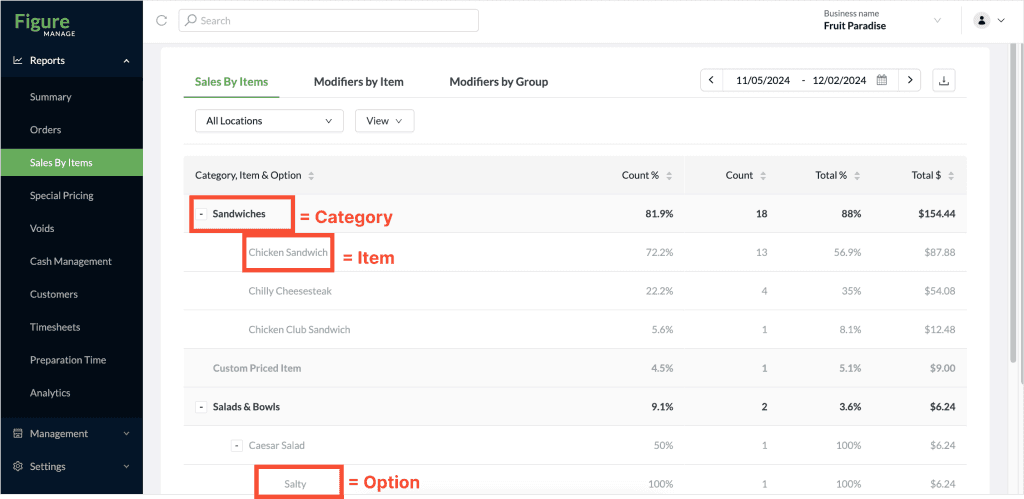
Categories – in this report, you will see Categories as they were created in Items & Categories; in the example you can see category Sandwiches.
Items – in this report, you will see Items as they were created in Items & Categories; in the example you can see items such a Chicken Sandwich or Caesar Salad
Options – in this report, you will see Options as they were created in Items & Categories
Modifier By Item
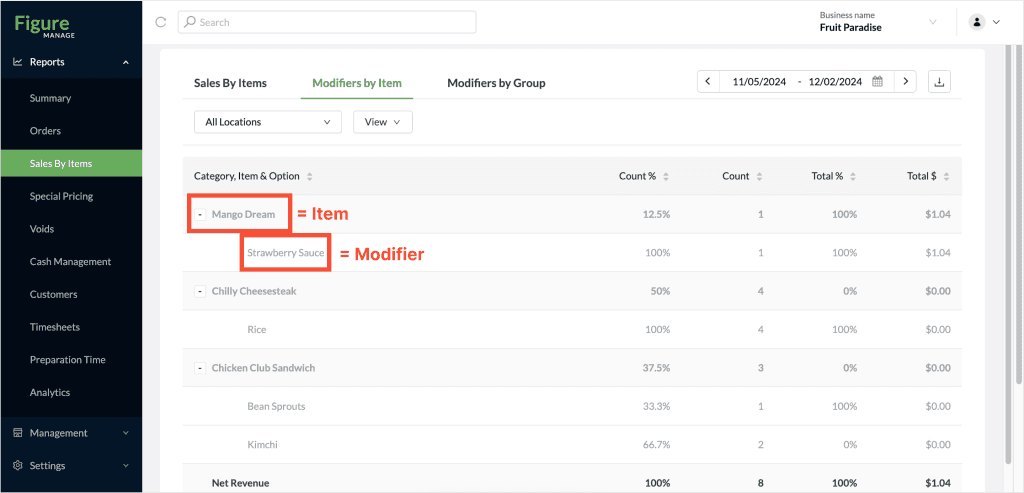
In this report, you can see the modifiers that were sold with certain items.
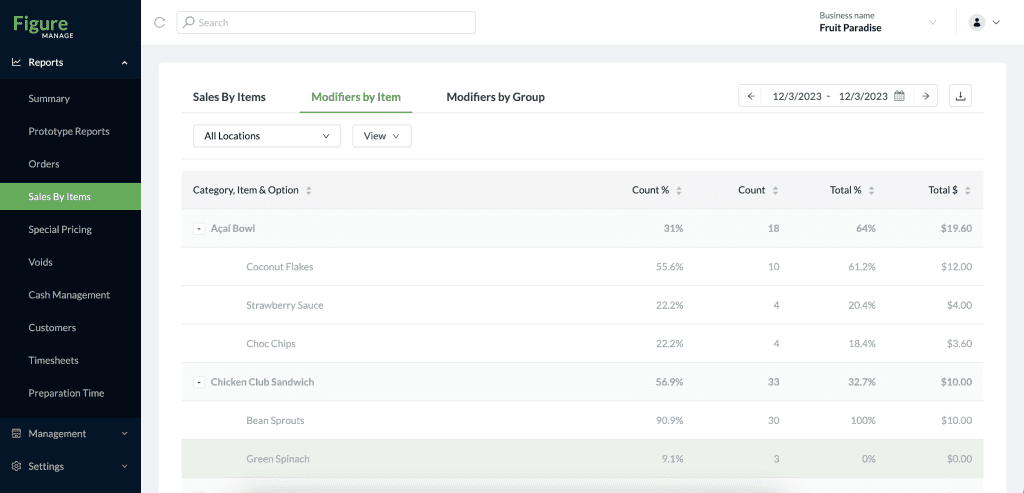
Use Case Example: Let's say you want to understand which topping is ordered most often with your Açaí Bowl. The "Modifiers by Item" report provides this insight. As shown in the screenshot of the report below, "Coconut Flakes" emerges as the favorite topping among customers:
Modifier By Group
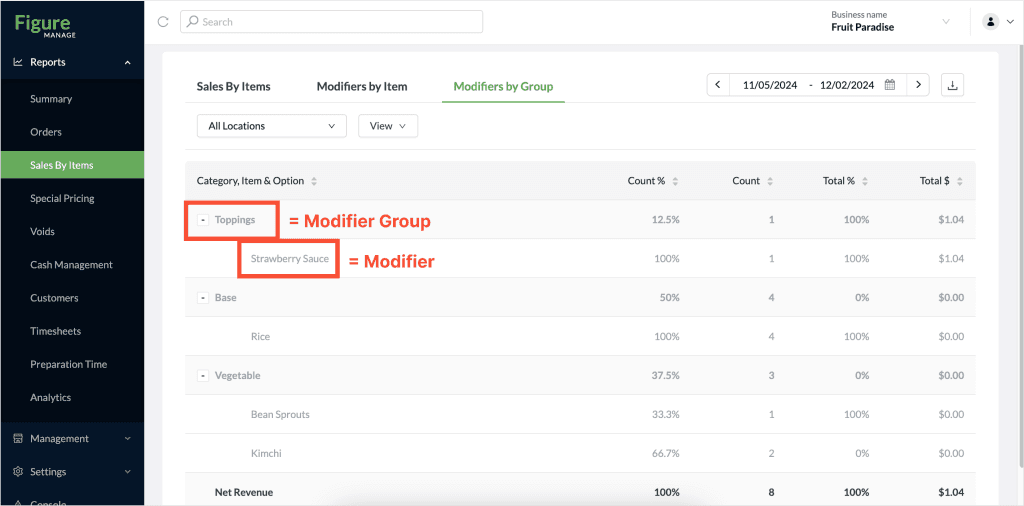
One Modifier can be assigned to multiple modifier groups. In this report, you can see what modifiers are being sold within which Modifier Groups.
How to download reports as CSV
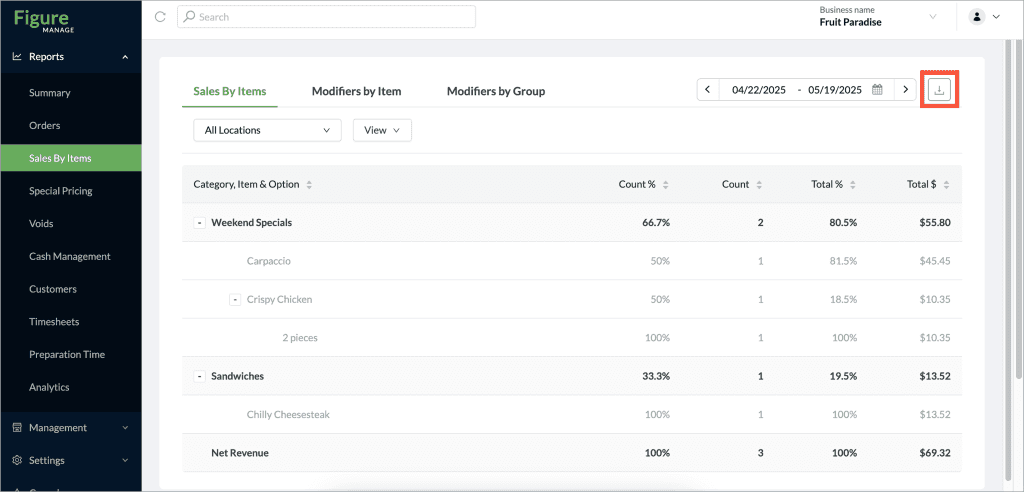
Each report can be exported in CSV by clicking the highlighted button in the screenshot below:
Example of the CSV export: